Functionality available with Analytics
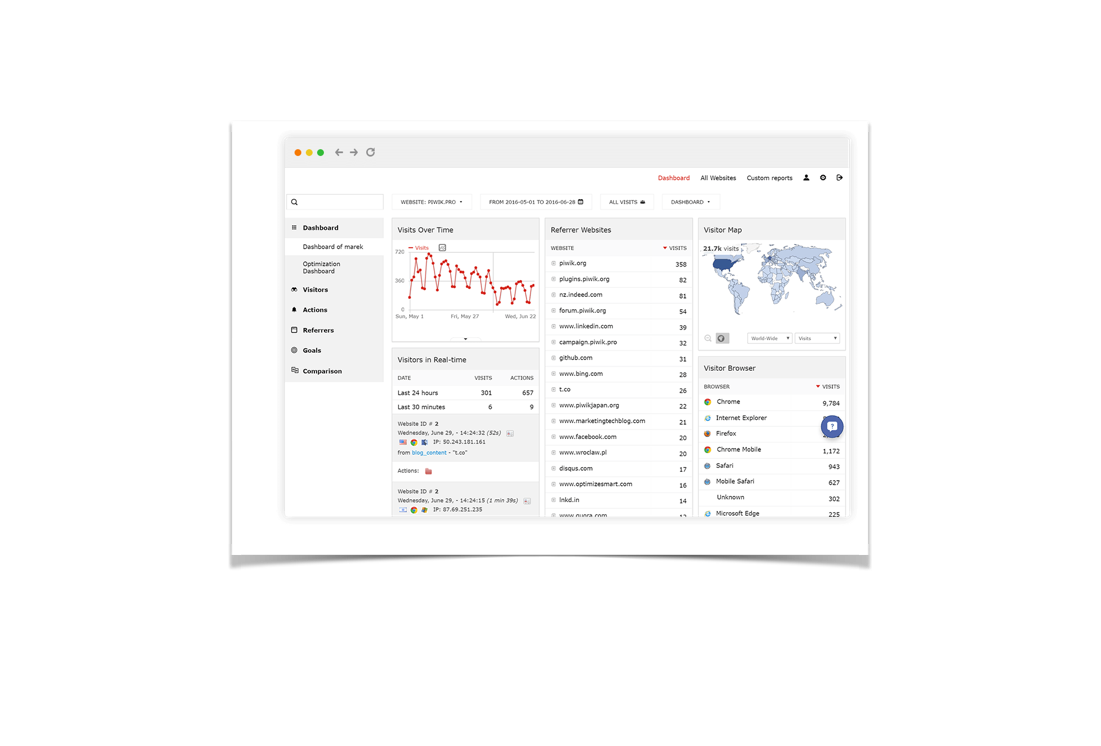
Customizable Dashboard
Overview of the performance of your tracked properties on the customizable dashboard. Create an unlimited number of separate dashboards for all aspects of your tracked properties.

No limits on widgets and dashboards
Don’t worry about any restrictions. Create an unlimited number of separate dashboards for all aspects of your tracked properties.

Real-time analytics dashboard
Use Live! Widgets to create a dashboard focused on your visitors and their actions on your website, all tracked and presented in real-time.

Clear data visualization
You decide how to display your data: in tables, pie charts, tag clouds, sparklines, or vertical bar graphs, just to name a few.

Comparison dashboard
View and compare the most important data from up to three different segments all in one place. Gain deeper insights to attract more traffic and learn how to increase conversions.
Reports are easy to create, edit, and move
Analytics Dashboard is easy to use. Select the reports you want from the dropdown list and they will appear on your dashboard. You can resize, shift, or drag and drop them to the desired position.
Easy to share
You can share the dashboard internally within your instance with other users. Reports, widgets, and even whole dashboards can be embedded into other websites and tools using HTML/Iframe. All reports can be exported in a variety of file formats.
Simple segmentation
It’s easy to apply segments to your dashboard. Either use the default options, or build your own custom segments to see the full picture of actions taking place on your website.
A dashboard for every website
Dashboards in can be adapted for every type of website and organization. No matter if you need mobile analytics, e-commerce data, or to capture the behavior of any website users, you can do that and more.